Find Best Neighborhood to Fight Pandemic in NYC - Data Preparation
Mar 30, 2020 · 3 Min Read · 8 Likes · 0 Comment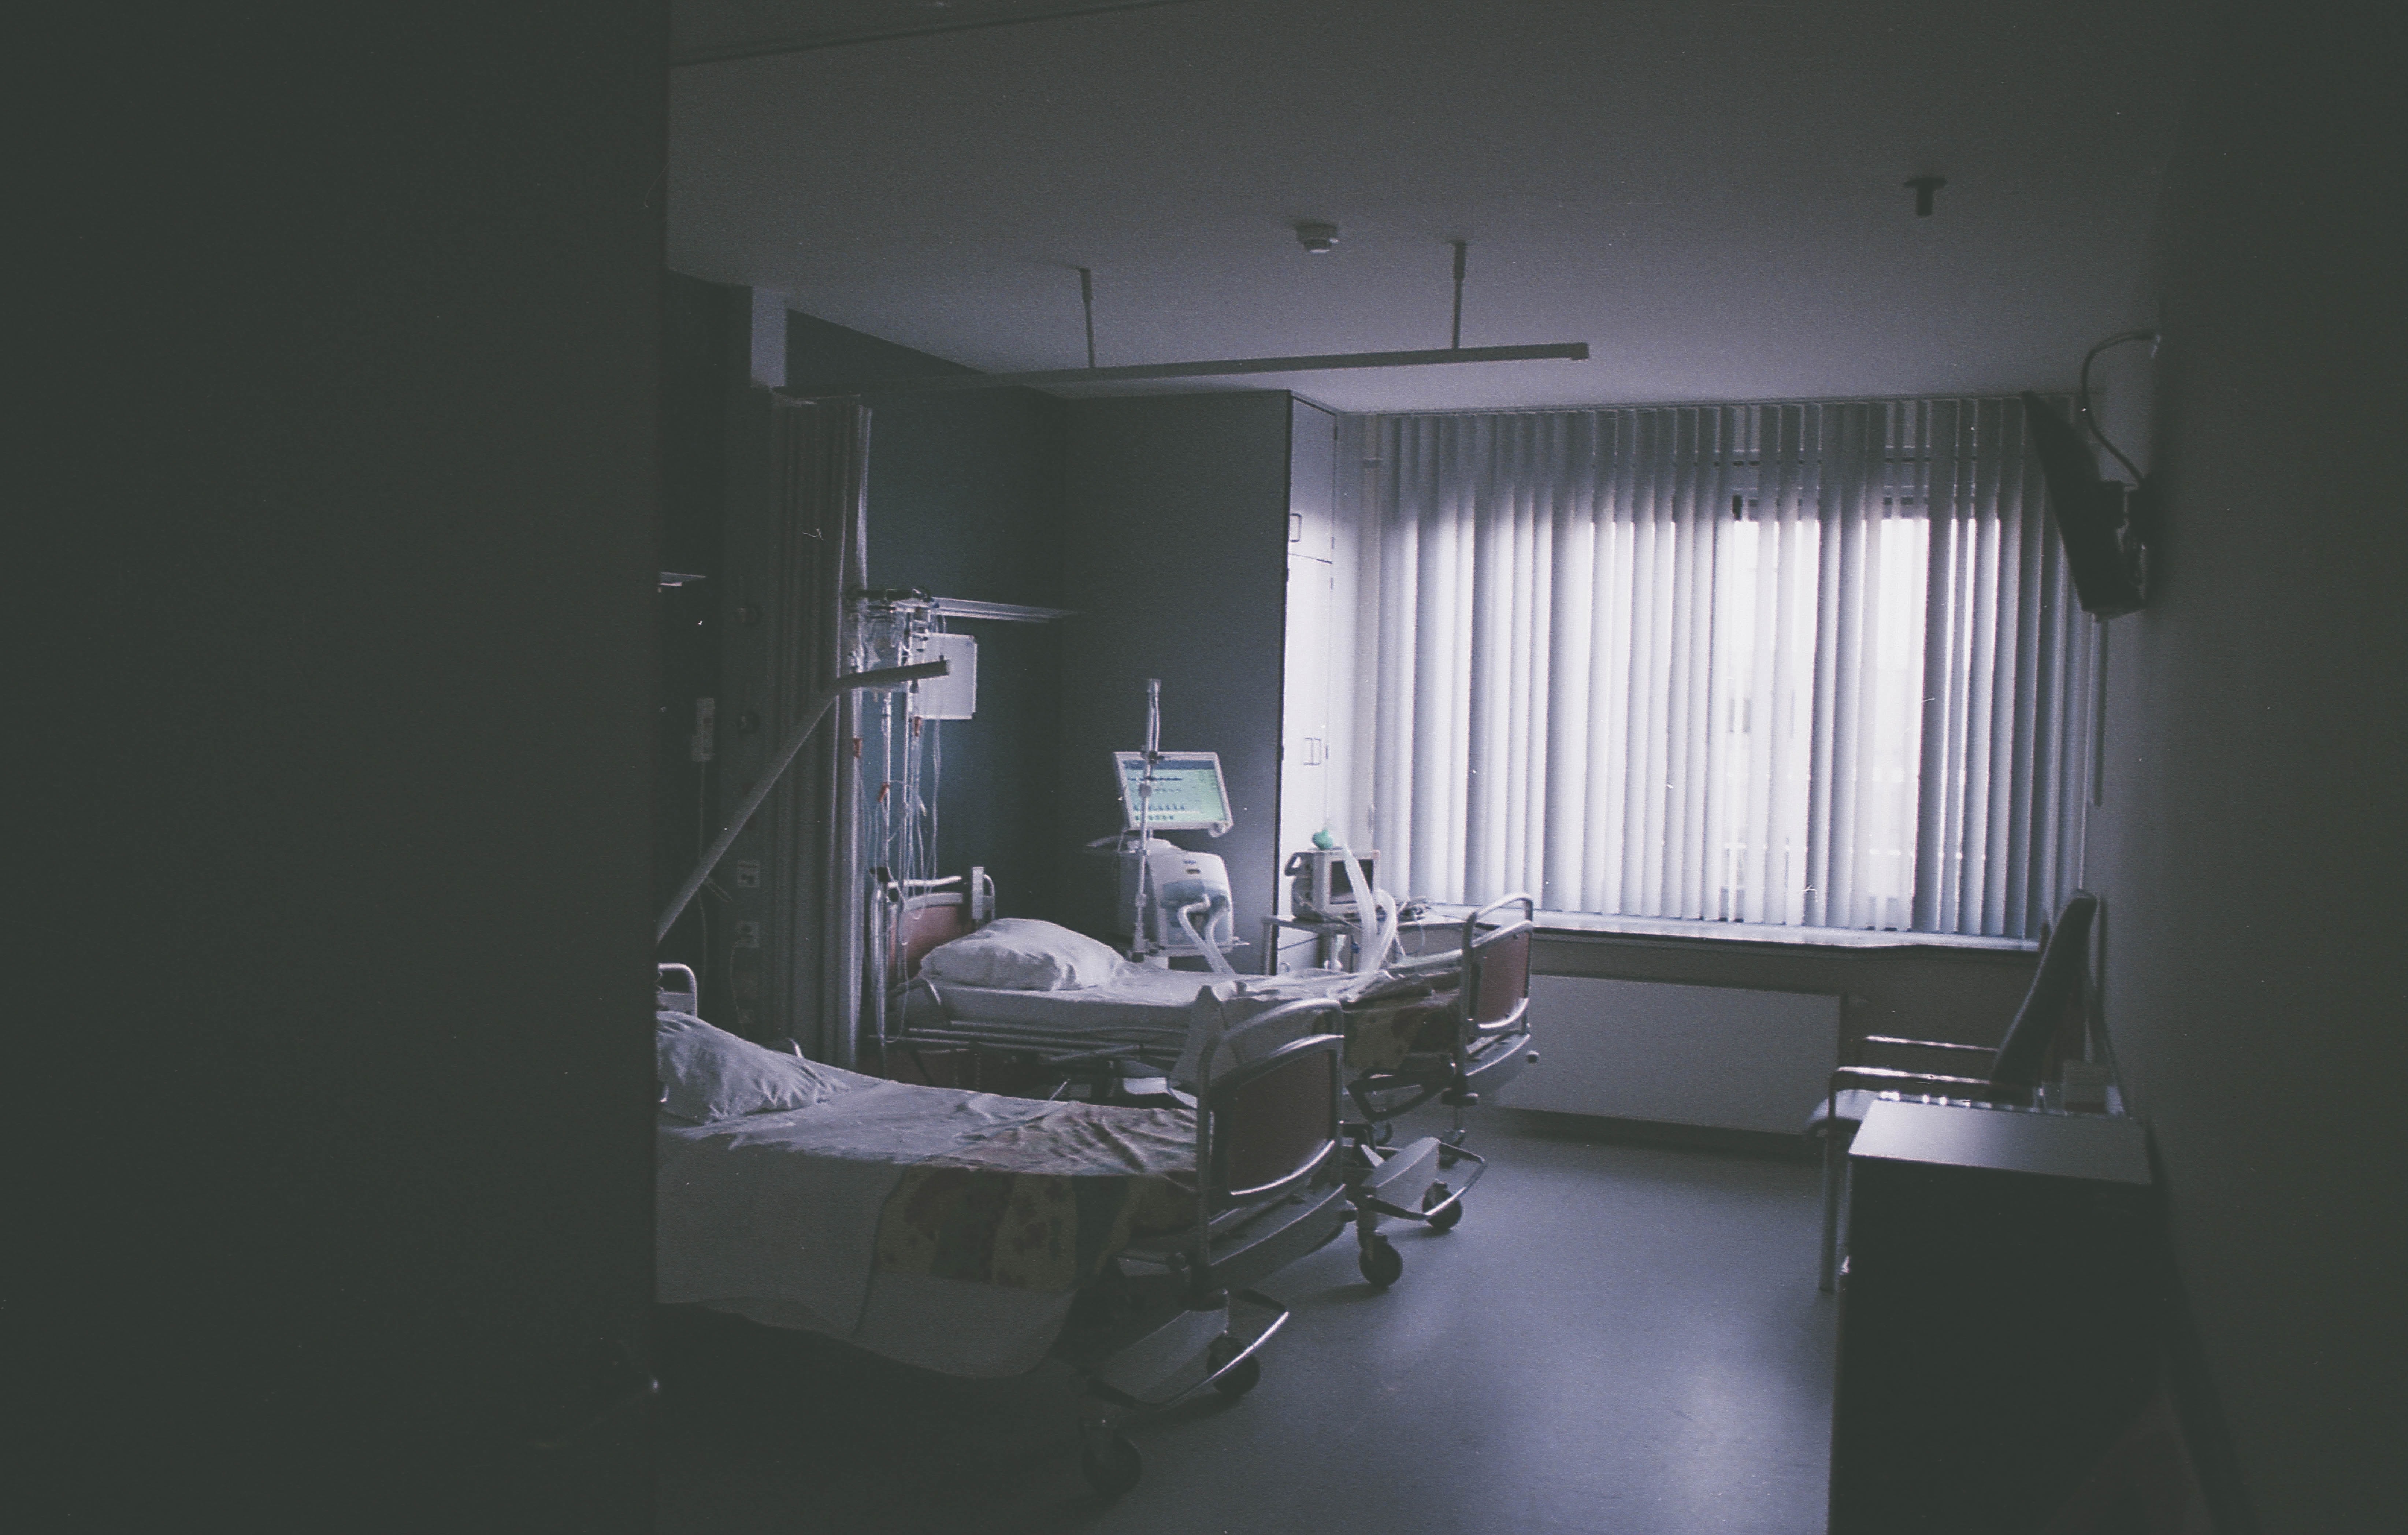
Disclaimer: this report has been generated as part of IBM Data Science Professional Certificate course’s final submission.
This report consists of three parts: business problem and data preparation, methodology, visualization and results. In this part, we will discuss about business problem and data preparation steps.
Business problem
Right now, New York is one of the worst hit state by COVID-19 in USA. New York city is at the center of the disaster. The hospitals are already stretched thin with patients overflowing. According to New York Times report, (at the moment of writing) death toll was 365, case count topped 23,000.
I was motivated by this to create something useful which would give some insight on this situation. In this project we are going to determine which neighborhood is best prepared for this pandemic, by finding out the best ratio of hospital beds per person for each neighborhood in this city.
By all means, the reports here should not be used as a measuring tool, because in reality the situation has been changed a lot since Coronavirus COVID-19 has hit the city.
Data
We will be collecting data from following sources:
- New York City data that contains borough, neighborhoods along with their latitudes and longitudes.
- Data source: NYC data set.
- We are going to get population data from Scraping Wikipedia.
- Data source: Wikipedia page of NYC neighborhood.
- We are going to go through each of the links of neighborhood and find the population of each of them.
- Hospital information is going to be fetched from foursquare API.
- Data source: foursquare API
- Hospital bed information is going to be fetched from NYS Health Profile website.
- Data source: NYS Health Profile.
Approach
This is our approach to resolve issue:
- Collect the New York city dataset.
- Collect population data for each neighborhood by scraping Wikipedia.
- Using Foursquare API we will get hospitals for each neighborhood.
- Collect hospital bed data by scraping data from NYS Health Profile.
- Data Visualization and some statistical analysis.
- Analyzing using Clustering (Specially K-Means).
- Find the best value of K
- Visualize the neighborhood max density of hospital beds per 100 people.
- Visualize the neighborhood max density of hospital ICU beds per 100 people.
- Inference From these results and related conclusions.
Data preparation
Data used in the analysis are listed below:
- First, collect the json dataset, which will contain borough, neighborhood, latitude and longitude information.
- neighborhood data in New York City will be collected from scraping the Wikipedia page. links given in the neighborhood section of the table will be visited via scraper, and find the population for each of them. Then data will be cleaned up and used to create a data frame containing borough, neighborhood and population.
- Hospitals per neighborhood information will be collected from foursquare API.
- We will collect bed and icu capacity information from NYS Health Profile website. Will be using selenium based scraping as this is a dynamic site.
Source code
Source code of this project can be found on github.
Conclusion
We will discuss about the methodologies we used to retrieve the results in next article.
Last updated: Jul 03, 2026