Find Best Neighborhood to Fight Pandemic in NYC - Methodology
Mar 30, 2020 · 4 Min Read · 6 Likes · 0 Comment
Disclaimer: this article has been generated as part of IBM Data Science Professional Certificate course’s final submission.
This report consists of three parts: business problem and data preparation, methodology, visualization and results. In this article we are going to describe the methodology we used in step by step:
Step one: New York city data with latitude and longitude
We are using requests to get the json data from nyc dataset and stored it in a data frame.

Step two: New York city data with population
Then we can use BeautifulSoup to scrape boroughs from Wikipedia. Then we have collected every link given in neighborhood column of the table. From each link, we can run iteration via requests to visit those Wikipedia pages, and scrap population data from right hand side table.

Step three: combine step one and step two
We can combine data frames from previous steps into one based on “neighborhood” and “borough”:

Here is a box chart of “Population” per “borough”:
Also, another box chart of “neighborhood” per “borough”:
Step four: collect hospital data from Foursquare
After collecting population data, now it is time to collect the hospital data. We can use the Foursquare API to fetch hospital data for latitude and longitude of each neighborhood from the previous dataset.

Step five: collect hospital bed data from NYS Health Profile
We can also collect hospital bed related data from NYS Health Profile website. We can scrap data by using Selenium with BeautifulSoap. We have collected the IDs of hospitals in NYC manually, and based on those IDs, we have scraped data from NYS Health Profile website. The data frame looks like this:

Step six: combine step four and step five
Now we are going to combine data from step four and step five. We are going to internally join the data frame based on “neighborhood” and “borough”.

We are going to clean up the data a little bit and sum up bed count and icu bed count grouping by “neighborhood” and “borough”:

Here is a box charts of “bed count” per “borough”:
Also another box charts of “ICU bed count” per “borough”:
Step seven: combine data from step three and step six
Now we are going to combine data from step three and step six. Means, we are going to combine the population data with hospital bed count data. We are going to merge two data frames based on “neighborhood” and “borough”. New data frame looks like this:

Step eight: add bed and icu per hundred people to data frame
Now we are going to calculate bed per hundred people based on two rows: Population and Bed Number. Then add this to the data frame. Similarly, we are going to add ICU data to data frame:

Step nine: K-means clustering
Now we are going to use k-means clustering to partition the data into k groups. we will be using elbow method to find the optimal number of k. The “elbow” (the point of inflection on the curve) is a good indication that the underlying model fits best at that point. In the visualizer “elbow”, value of k is 3.
Step ten: merge cluster labels with dataset
After that, we are going to merge cluster labels of groups with data frames. The data frame looks like this:

Step eleven: see which borough goes to which cluster
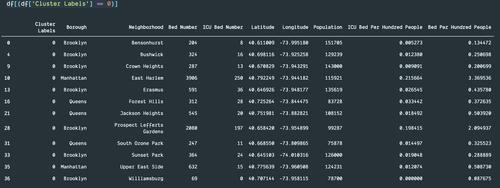
Let us see which boroughs belong to which clusters.
Here is the dataset for cluster 0:
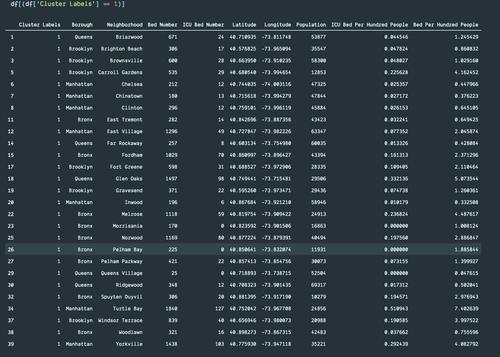
Here is the dataset for cluster 1:
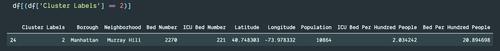
Here is the dataset for cluster 2:
Step twelve: neighborhoods without hospital
So far, we have analyzed dataset for neighborhoods with hospitals. Now, we should look into neighborhoods without hospital data:

If we see the indexes of neighborhoods with and without hospital, it should look like this:
We can see that there are 100 neighborhoods which does not have any hospital.
Conclusion
In next article, we are going to visualize the data collected from previous steps and discuss about our results.
Last updated: Jul 03, 2026